By default , after SQL server installation complete the 1433 port will be listen on all IP 0.0.0.0:1433
How to config it to listen only on one IP ?
By default , after SQL server installation complete the 1433 port will be listen on all IP 0.0.0.0:1433
How to config it to listen only on one IP ?
I see that prior to SQL 2019, it is not possible to use CREATE DATABASE ..... SNAPSHOT when there are memory-optimized tables.
We develop a CRM system on SQL, that is then hosted by our clients or a 3rd party on their behalf, so we are not in control of the environment. As implementing memory-optimized tables can't be reversed, I am understandably wary of proceeding, even though in my initial in-house testing I have seen dramatic performance improvements.
We don't use the above function in code, but one thing I wanted to check is whether it is just that that is prevented. If a commercial backup utility is used for backups of individual databases, are those types of snapshots also affected?
Using SQL Server 2016. The first dataset uses a clustered columnstore index and the second a rowstore.
17 seconds vs. 2:16 or so.
The 2 datasets are from different databases. The execution plan for the first is the same whether run on its own or with the UNION. The second selects a different (bad) execution plan when run with the UNION.
Why would that be?
This is more a general comment than a question but if anyone has a theory about why the optimiser would do this, I'd love to hear it.
FTR, I fixed it by selecting into a TEMP table as 2 separate queries then SELECT the TEMP table.
Nick Ryan MIS Programmer Analyst, ANZ Bank
My team just completed a migration of business logic jobs and databases from 2008 R2 to a 2014 Always On cluster. The 2008 R2 server hosted databases, SSIS packages, and SQL Agent scheduled jobs. We separated out the scheduled jobs and SSIS packages on a new stand-alone server and the databases migrated to the cluster. The migrated databases have stored procs in them. The procs are called from the stand-alone job server using CmdExec job steps as in: SQLCMD -S <fully qualified server name> -d <db name> -Q "EXEC <sproc name>".
One of the stored procs is running very slow, but completes. What tools can i use to diagnose where the problem query is within the stored proc while the job is running? I don't have the benefit of running the stored proc code interactively and looking at the resulting execution plan as there are staging tables that need to be processed by other steps in the scheduled job. Are there DMVs or extended events that can pinpoint the cause of the slow running proc? Thanks.
I have an ETL process that is scheduled to run in the wee hours of the morning. The last few days it has been failing with the error "The transaction log for database [mydb] is full due to 'LOG_BACKUP'"
So we have had issues with having to increase the TLog space, but if I run this same ETL process a little later in the morning, then it completeswith just barely enough room, leaving just a few MB left on the TLog free after completing. It completes with no errors.
Typically when I see issues with the TLog running out of space I start looking at the size of the data flows being used.
So now I am considering something else. Could it be that the TLog isn't getting backed up ?
I ran this, and my Db is getting its Tlog backed up every 3 hours, and the time when this job runs there should have been plenty of time for another run of the
select database_name, backup_finish_date
from msdb..backupset
where type = 'L'
ORDER BY backup_finish_date desc
So what else can I check?
Hey,
I have a table where transaction , and all dates are stored in UTC
the server is in AZURE and it's SQL SERVER 2016
when I run the following query I get very strange results
SELECT T.TransactionDate AT TIME ZONE 'GMT Standard Time' DATEinGMT,T.TransactionDate
FROM dbo.Transactions AS T
WHERE T.TransactionDateKey = 20190331
      AND T.TransactionDate AT TIME ZONE 'GMT Standard Time'
      BETWEEN '2019-03-31 00:59:00 +00:00' AND '2019-03-31 01:01:00 +00:00';
and here is what is get in output
it seems like AT TIME ZONE function in the where clause has different values from the select part
any explanation for this ?
We are getting a non-yielding scheduler error on our new SQL Server 2019 boxes. This started when someone ran a query yesterday and in the error log it kicks off a BEGIN STACK DUMP Looking at this:
It seems this is due to bugs (subsequently patched) in SQL Server. Others suggest it could also be an IO problem (IO is very low however, next to nothing). Can anyone advise?
Error extracted from log is below:
01/13/2020 10:45:50,Server,Unknown,Process 0:0:0 (0xa08) Worker 0x000001E6034CC160 appears to be non-yielding on Scheduler 8. Thread creation time: 13223301429074. Approx Thread CPU Used: kernel 0 ms<c/> user 192390 ms. Process Utilization 6%. System Idle 93%. Interval: 197693 ms.I have a very simple table with just one column and one row of data. I try to convert it to a temporal table with these commands:
ALTER TABLE TBD_salesperson
ADD
sys_start_time DATETIME2 GENERATED ALWAYS AS ROW START HIDDEN DEFAULT SYSUTCDATETIME()
, sys_end_time DATETIME2 GENERATED ALWAYS AS ROW END HIDDEN DEFAULT CONVERT(DATETIME2, '9999-12-31 23:59:59')
, PERIOD FOR SYSTEM_TIME (sys_start_time, sys_end_time);
GO
ALTER TABLE TBD_salesperson
SET (SYSTEM_VERSIONING = ON (HISTORY_TABLE = dbo.TBD_history_salesperson));
And I get this error:
Msg 13575, Level 16, State 0, Line 1
ADD PERIOD FOR SYSTEM_TIME failed because table 'vcc-max.dbo.TBD_salesperson' contains records where end of period is not equal to MAX datetime.
How can that be? I only have one row in the table and the only column is an id field. I tried both on Azure SQL and with a local db and got the same result.
Please help.
We have 4 levels of related tables(which are below) and want to partition by year. Each level of table has primary key. Should i use primary key of each table as a partition key(by getting the range for each year) or should I use Foreign key as a partition key to partition the tables.
Which approach is the best one to do it.
-------- Parent-----------------------------------------------your help would be appreciated.
HI Team,
We have applied CU11 on one of production server, post CU11, sql services was offline, then we bring online with T912 trace, post we ran msdb110_upgrade.sql on server. then we got below error massage. Please help me
Thanks in advance
------------------------------------------
Execution of POST_SQLAGENT100.SQL complete
------------------------------------------
------------------------------------
Moving 2005 SSIS Data to 2008 tables
------------------------------------
Mapping SSIS yukon roles to katmai roles...
Moving package folders...
Moving packages...
Moving logs...
Dropping yukon stored procedures...
Dropping yukon tables...
Creating sysdtslog90 view...
Database name 'tempdb' ignored, referencing object in tempdb.
Database name 'tempdb' ignored, referencing object in tempdb.
Configuration option 'show advanced options' changed from 1 to 1. Run the RECONFIGURE statement to install.
Msg 574, Level 16, State 0, Procedure #sp_enable_component____________________________________________________________________________________________________00000F59, Line 11 [Batch Start Line 64771]
CONFIG statement cannot be used inside a user transaction.
Configuration option 'Agent XPs' changed from 1 to 1. Run the RECONFIGURE statement to install.
Msg 574, Level 16, State 0, Procedure #sp_enable_component____________________________________________________________________________________________________00000F59, Line 13 [Batch Start Line 64771]
CONFIG statement cannot be used inside a user transaction.
Executing msdb.dbo.sp_syspolicy_create_purge_job
Configuration option 'Agent XPs' changed from 1 to 1. Run the RECONFIGURE statement to install.
Msg 574, Level 16, State 0, Procedure #sp_restore_component_state_____________________________________________________________________________________________00000F59, Line 9 [Batch Start Line 64771]
CONFIG statement cannot be used inside a user transaction.
Configuration option 'show advanced options' changed from 1 to 1. Run the RECONFIGURE statement to install.
Msg 574, Level 16, State 0, Procedure #sp_restore_component_state_____________________________________________________________________________________________00000F59, Line 11 [Batch Start Line 64771]
CONFIG statement cannot be used inside a user transaction.
post_dc100::Enabling Agent XPs before restoring data collector original state
Configuration option 'show advanced options' changed from 1 to 1. Run the RECONFIGURE statement to install.
Msg 574, Level 16, State 0, Procedure #sp_enable_component____________________________________________________________________________________________________00000F59, Line 11 [Batch Start Line 65039]
CONFIG statement cannot be used inside a user transaction.
Configuration option 'Agent XPs' changed from 1 to 1. Run the RECONFIGURE statement to install.
Msg 574, Level 16, State 0, Procedure #sp_enable_component____________________________________________________________________________________________________00000F59, Line 13 [Batch Start Line 65039]
CONFIG statement cannot be used inside a user transaction.
Data Collector Status
CollectorEnabled:0
Collection set status
Uid:7B191952-8ECF-4E12-AEB2-EF646EF79FEF, Name:Disk Usage, IsRunning:0
Uid:49268954-4FD4-4EB6-AA04-CD59D9BB5714, Name:Server Activity, IsRunning:0
Uid:2DC02BD6-E230-4C05-8516-4E8C0EF21F95, Name:Query Statistics, IsRunning:0
Uid:ABA37A22-8039-48C6-8F8F-39BFE0A195DF, Name:Utility Information, IsRunning:0
post_dc100::uploading instmdw.sql to msdb ...
Uploading instmdw.sql from disk: C:\Program Files\Microsoft SQL Server\MSSQL13.MSSQLSERVER\MSSQL\Install\instmdw.sql
Loaded 1332276 bytes from 'C:\Program Files\Microsoft SQL Server\MSSQL13.MSSQLSERVER\MSSQL\Install\instmdw.sql'
post_dc100::Checking if collection set status were captured in temp table...
post_dc100::Restoring collection set running status...
The state of the collection set has changed, but it will not start or stop until the collector is enabled.
post_dc100::Checking if Data collector was enabled before upgrade...
post_dc100::Current data collector state is same as pre-upgrade state
Data Collector Status
CollectorEnabled:0
Collection set status
Uid:7B191952-8ECF-4E12-AEB2-EF646EF79FEF, Name:Disk Usage, IsRunning:0
Uid:49268954-4FD4-4EB6-AA04-CD59D9BB5714, Name:Server Activity, IsRunning:0
Uid:2DC02BD6-E230-4C05-8516-4E8C0EF21F95, Name:Query Statistics, IsRunning:0
Uid:ABA37A22-8039-48C6-8F8F-39BFE0A195DF, Name:Utility Information, IsRunning:0
Configuration option 'Agent XPs' changed from 1 to 1. Run the RECONFIGURE statement to install.
Msg 574, Level 16, State 0, Procedure #sp_restore_component_state_____________________________________________________________________________________________00000F59, Line 9 [Batch Start Line 65039]
CONFIG statement cannot be used inside a user transaction.
Configuration option 'show advanced options' changed from 1 to 1. Run the RECONFIGURE statement to install.
Msg 574, Level 16, State 0, Procedure #sp_restore_component_state_____________________________________________________________________________________________00000F59, Line 11 [Batch Start Line 65039]
CONFIG statement cannot be used inside a user transaction.
Restored implicit transactions state to OFF
Upgrading Database Mail related objects...
Completed upgrade of Database Mail related objects...
Hi All,
Recently in one of our sub-prod env , the drive space got filled up.
I tried to pull out free space information using dmvs and see if there is any room for shrink operation.
USE dbname
GO
DBCC SHRINKFILE (N'db_name_dat' , 0, TRUNCATEONLY)
GO
It was not at all releasing space to OS. Later after waiting for 30-40 mins , I killed the Shrink statement.
I wrote a custom sql script which actually try to shrink the mdf file in small chunks (i.e. 50 MB). even then it is taking long time. its been more than a day, it released only 3 GB space so far and still the shrink job is running.
Note: The SPID was never blocked.
Thanks,
Sam
I am facing communication link error while running a ssis project. I found that it could be due to alteration in network packet size value but its value is default which is 4096 bytes.
how to fix this?
Hi,
Need some quick help here.
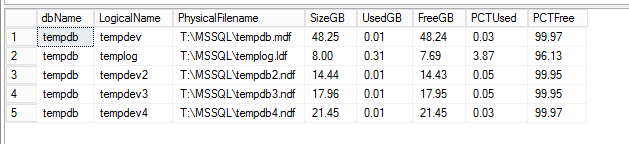
I am unable to shrink tempdb files. There is lot of available free space.
DBCC loginfo
We have an alert and incident opened for this and we have to close it.
Other thing is that systems/storage team is not going to give us more space
There are no open transactions, I don't know why I am not able to shrink these db's. I know they are unevenly distributed, I mean sizing and auto growth settings but as of now , looking for a way to getting some space released to OS.
Also is there a way to fix this without SQL Server restart.
Regards,
Sam
Hi,
I would like to investigate the following scenario: A select statement is executed several thousands times, in a batch transaction. Execution time and worker time differs from 85 μs to 200 ms while the execution time is the same using a nonclustered index and key lookup. Statement always returns 1 row and logical reads differ from 7 to 10 for all executions (something expected since we are seeking in an index after all). I know I do not provide a lot of the actual information but I would like to brainstorm as of what else could inflict this execution time degradation (could it be that it is in a transaction, which stays open until all batch finishes and why?) Host CPU does not show any high activity, storage IO (sec/read) makes several spikes during execution but mostly stays under 5 ms.
Other architecture information: VMWare virtualization, Failover Cluster instance (although I do not see any relation).
If you need any further information that i can clarify please ask me. As I said I do not seek an actual solution for my environment but more of a guide to what else I could investigate in order to find and tune the culprit.
I found the information in dm_exec_query_stats.
Best regards,
Marios
We've been experimenting with Polybase on a SQL Server 2019 (CU1) box and the performance is pretty awful. We've gone as far as scripting every statistic from the remote server onto the external tables in 2019, with no change. You can see the performance difference here (two runs of the same query back to back)(servers are setup identical resource wise - 32GBs of RAM, 8 vCPU, SSD disks - and the remote server is SQL Server 2016 with the latest CU):
SOURCE:
(313585rows affected)
 SQL Server Execution Times:
   CPU time =4019 ms,  elapsed time =5160 ms.(313585rows affected)
 SQL Server Execution Times:
   CPU time =4063 ms,  elapsed time =5048 ms.
POLYBASE with PUSHDOWN OFF:
(313585rows affected)
 SQL Server Execution Times:
   CPU time =2891 ms,  elapsed time =132820 ms.(313585rows affected)
 SQL Server Execution Times:
   CPU time =2594 ms,  elapsed time =52217 ms.
POLYBASE with PUSHDOWN ON:
SQL Server parse and compile time:
   CPU time =0 ms, elapsed time =11 ms.(313585rows affected)
 SQL Server Execution Times:
   CPU time =2641 ms,  elapsed time =131960 ms.

SQL Server parse and compile time:
   CPU time =109 ms, elapsed time =126 ms.(313585rows affected)
 SQL Server Execution Times:
   CPU time =3906 ms,  elapsed time =88548 ms.
That's roughly a 2100% increase in the time it takes for the two queries to run. What's confusing is that Microsoft is pushing Polybase (data virtualization) as an ETL replacement, but there is no way that's possible with this kind of performance.
Are other people seeing this kind of poor performance using Polybase with connections from SQL Server to SQL Server?
Thanks.
After installing CU2 for SQL Server 2019, the SQL Agent process continually runs the following 2 queries:
SELECT N'Testing Connection...'
select ag.name from sys.availability_groups AS ag INNER JOIN sys.dm_hadr_availability_replica_states AS ars ON ag.group_id = ars.group_id where ag.is_contained = 1 and ars.is_local = 1 and ars.role = 1
I do not have any high availability groups set up. This behavior is happening on 3 different test servers. Uninstalling CU2 eliminates this behavior.
sharma priya
Hi,
We are trying to run following query in SQL cmd but it is failing error.
SQLCMD query
Code
:setvar Mode [$Mode]
:setvar Version [$Version]
:setvar LogicImageDir [$LogicImageDir]
:setvar DatabaseName [$Database]
:setvar DefaultFilePrefix "test"
:setvar DefaultDataPath "C:\MSSQL\Data\"
:setvar DefaultLogPath "C:\MSSQL\Log\"
GO
:on error exit
GO
/*
Detect SQLCMD mode and disable script execution if SQLCMD mode is not supported.
To re-enable the script after enabling SQLCMD mode, execute the following:
SET NOEXEC OFF;
*/
:setvar __IsSqlCmdEnabled "True"
GO
IF N'$(__IsSqlCmdEnabled)' NOT LIKE N'True'
BEGIN
PRINT N'SQLCMD mode must be enabled to successfully execute this script.';
SET NOEXEC ON;
END
GO
USE [$(DatabaseName)]; -- execution
gives an error at this point
-----not the complete code
Error
Appreciate your help. Thank you.